HKBU data journalism workshops on May 26, 2016.
FT中文网

Data Journalism 101

HKBU | May 2016

@silvashih

A bit about me

    Data editor of FTChinese based in Beijing. Making data-driven stories and reporting on Taiwan.

    You'll leave this 2-day-workshop knowing:

    • What is data journalism and what is not.
    • What is data and what is not.
    • How to critique and improve charts.
    • How to keep learning by yourself.

Section 1

What is data journalism?

short answer

Tell stories with data.

It started way
before you think it did.

Why do people care about it so much now?

The why shapes how you do things.

Tools advanced.

The forces behind the story.


數據:紅色預警拯救北京空氣?(FT中文網)

But people still misunderstand the beauty of data journalism in some ways.

data journalist = researcher?

"Hey Lisa. Could you pull all the relevant clips on that for me?"


data report = infographic?

What a data-driven story looks like?

  • text
  • charts
  • graphics
  • news apps
  • ....

Multiple skills

  • text → writing
  • charts → statistic+design+(coding)
  • graphics → statistic+design+(coding)
  • news app → coding
  • .... → ?

Normally,
it takes a TEAM to do the job.

FTC

me+1/2 developer

FT interactive

    coders, designers, statisticians, map-makers.

Caixin:cross-functional

The way to make data-driven stories is similar.

Process

  • data first.
  • story first.
  • question first.
  • Always ask yourself:

    why and how to use data to make story better?

    Lunch break

    Section 2

    What is data?

    Machine readable

    structured data

    reference link

    XLS (excel)

    CSV

    comma-seperated value

    TSV

    tab-seperated value

    JSON

    XML

    NOT structured data

    PDF

    covert PDF to csv

    JPEG/PNG/GIF (img)

    huh?

    Optical-character recognition (OCR)

    Tools:

    google " X to X converter"

    Where to find data?

    Google it.

    • Think Tank
    • Government
    • Companies who own unique data (Business reporting)
    • Academic paper *
    • Collect it yourself *
    • Wise man *
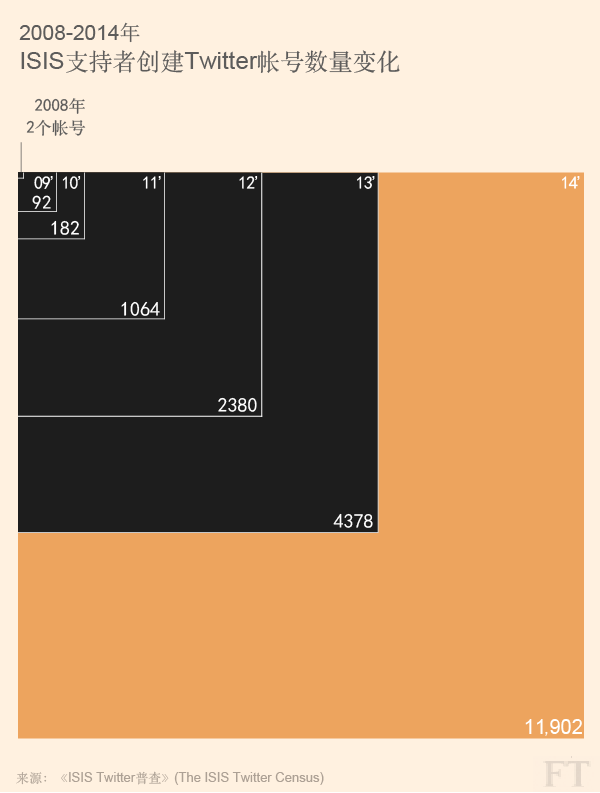
    中國土壤防治資金缺口巨大(FT中文網,2016)
    分析:十二五時期,這些詞影響了中國(FT中文網,2016)

    Speed data-ing

    Google spreadsheet

    number vs. text

    =

    +-x ÷

    ranking

    =sum( )

    =average( )

    =IMPORTHTML(URL,"table", 1)

    Exercise:

    http://goo.gl/Jr1Dh

    Q: how many visitor arrivals in 2014?

    Q: Which category has the most serious decline?

    https://data.gov.hk/en/

    http://data.worldbank.org/

    Knowing bad data.

    Which one is May?

    27/5/16

    5/27/15

    Further explore: Quartz's bad data guide

    See you.

    @silvashih
    silva.shih@ft.com
    www.ftchinese.com/channel/datanews.html

    Section 3

    Make data beautiful

    Recap

    Yes, I've got the data and make it clean. What's next?

    Data story:

    • text
    • chart
    • graphic
    • news app
    • ....

    What is the best way to present data?

    Basic Charts

    reference

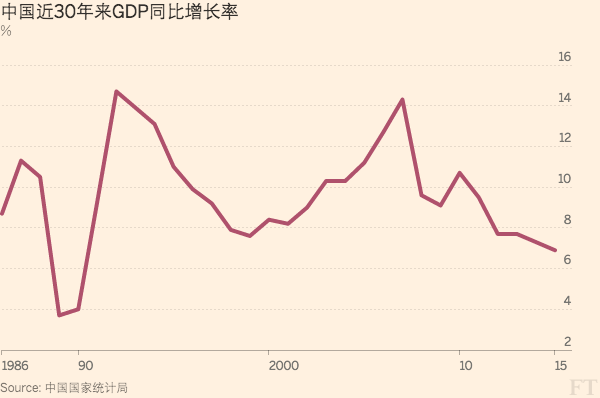
    Line

    Track changes over time.

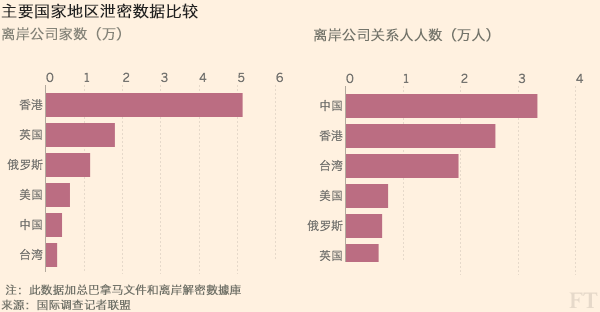
    Bar

    Compare categories

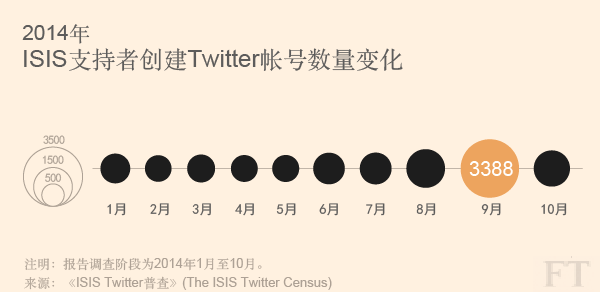
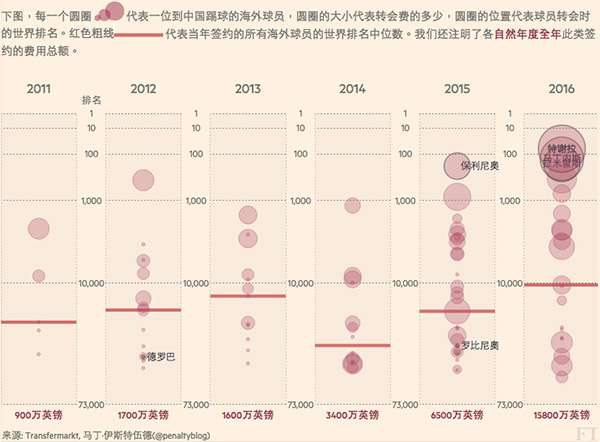
    Bubble

    compare

    Bubble

    Common Tools

    • Adobe illustrator
    • Excel/google spreadsheet
    • free tools online (google it)
    • d3.js

    Basic design rules

    reference

    The goal should be clarity rather than simplicity.

    Excercise

    google spreadsheet

    Quartz's chartbuilder

    How to cheat with charts?

    Apple is either terrible at designing charts or thinks you won’t notice the difference (Quartz, 2013)
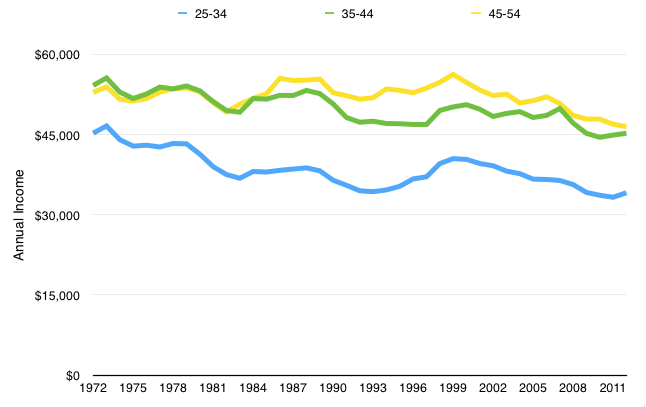
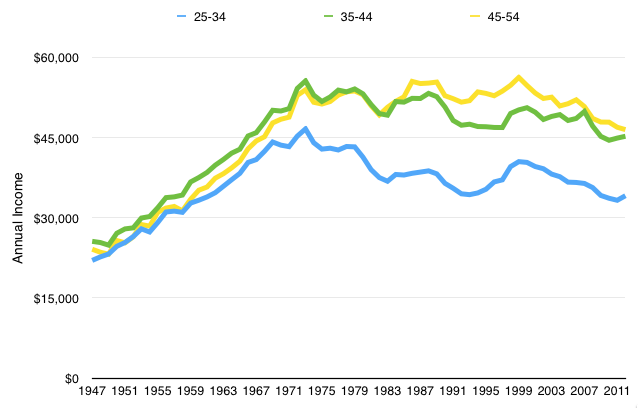
    For U.S. Men, 40 Years of Falling Income
    How journalists make arguments with distorted data
    How journalists make arguments with distorted data
    One Report, Diverging Perspectives (NYT, 2012)

    hiding something?

    Section 4

    Going further

    Global Trends

    Trend 1

    Skills level up


    Japan: the next big quake(FT, 2016)

    How green Germany really is (Berliner Morgenpost, 2016)

    Is the Nasdaq in Another Bubble?(WSJ, 2015)

    Trend 2

    Mobile centric

    Scroll


    How the U.S. and OPEC Drive Oil Prices(NYT, 2015)

    Who are the best ever Formula One drivers?(FT, 2015)

    Static (gif)


    America’s Middle-class Meltdown: Core shrinks to half of US homes(FT, 2016)

    "Static images are the most effective form of communication."
    Archie Tse, NYT

    “If it doesn’t work on mobile, it doesn’t work."

    Trend 3

    Coversation with readers

    气候变化计算器(FT中文, 2015)

    What do Britons abroad think of Brexit? (FT, 2016)
    What do Britons abroad think of Brexit? (FT, 2016)
    The Counted: People killed by police in the US(Guardian US, 2015)
    Methodology and code(Buzzfeed, 2016)

    How BuzzFeed News Used Betting Data To Investigate Match-Fixing In Tennis(Buzzfeed, 2016)

    The Color of Debt(Propublica, 2015)

    The Color of Debt(Propublica, 2015)

    Trend 4

    Collaboration

    Journalism + civic hack

    Code for Africa
    Taiwan's g0v
    Taiwan's g0v

    Question remained

    Going further

    how to train yourself?

    I'm not born with these skills.

    • Majored in public administration in college.
    • Trained magazine writing for almost 5 yrs.
    • Expolore the possibility of the future of journalism in graduate school. Taught myself ever since.

    Unlimited resources on the internet

    People.

    Connect the dots.

    People → knowing who to follow.

    FTChinese.com

    FT Data blog/interactive

    bloomberg graphics

    nikkei's visual data

    #ddj #dataviz

    NICAR 2016 Slides, Links & Tutorials #NICAR16

    Connect the dots → Cross the border.

    Design + Coding + Journalism + Thinking wild

    Thanks!

    @silvashih

    silva.shih@ft.com

    www.ftchinese.com/channel/datanews.html